Derivatives Rollover Report |October 26, 2018
It was the second consecutive series that witnessed another strong bout of selling courtesy to global sell-off. It was
observed that, every attempt of some respite in the index was getting sold into and eventually index concluded the
series with a substantial cut of nearly 8%. Despite this carnage in the broader market, banking and Mid-cap baskets
somehow managed outperform the benchmark index.
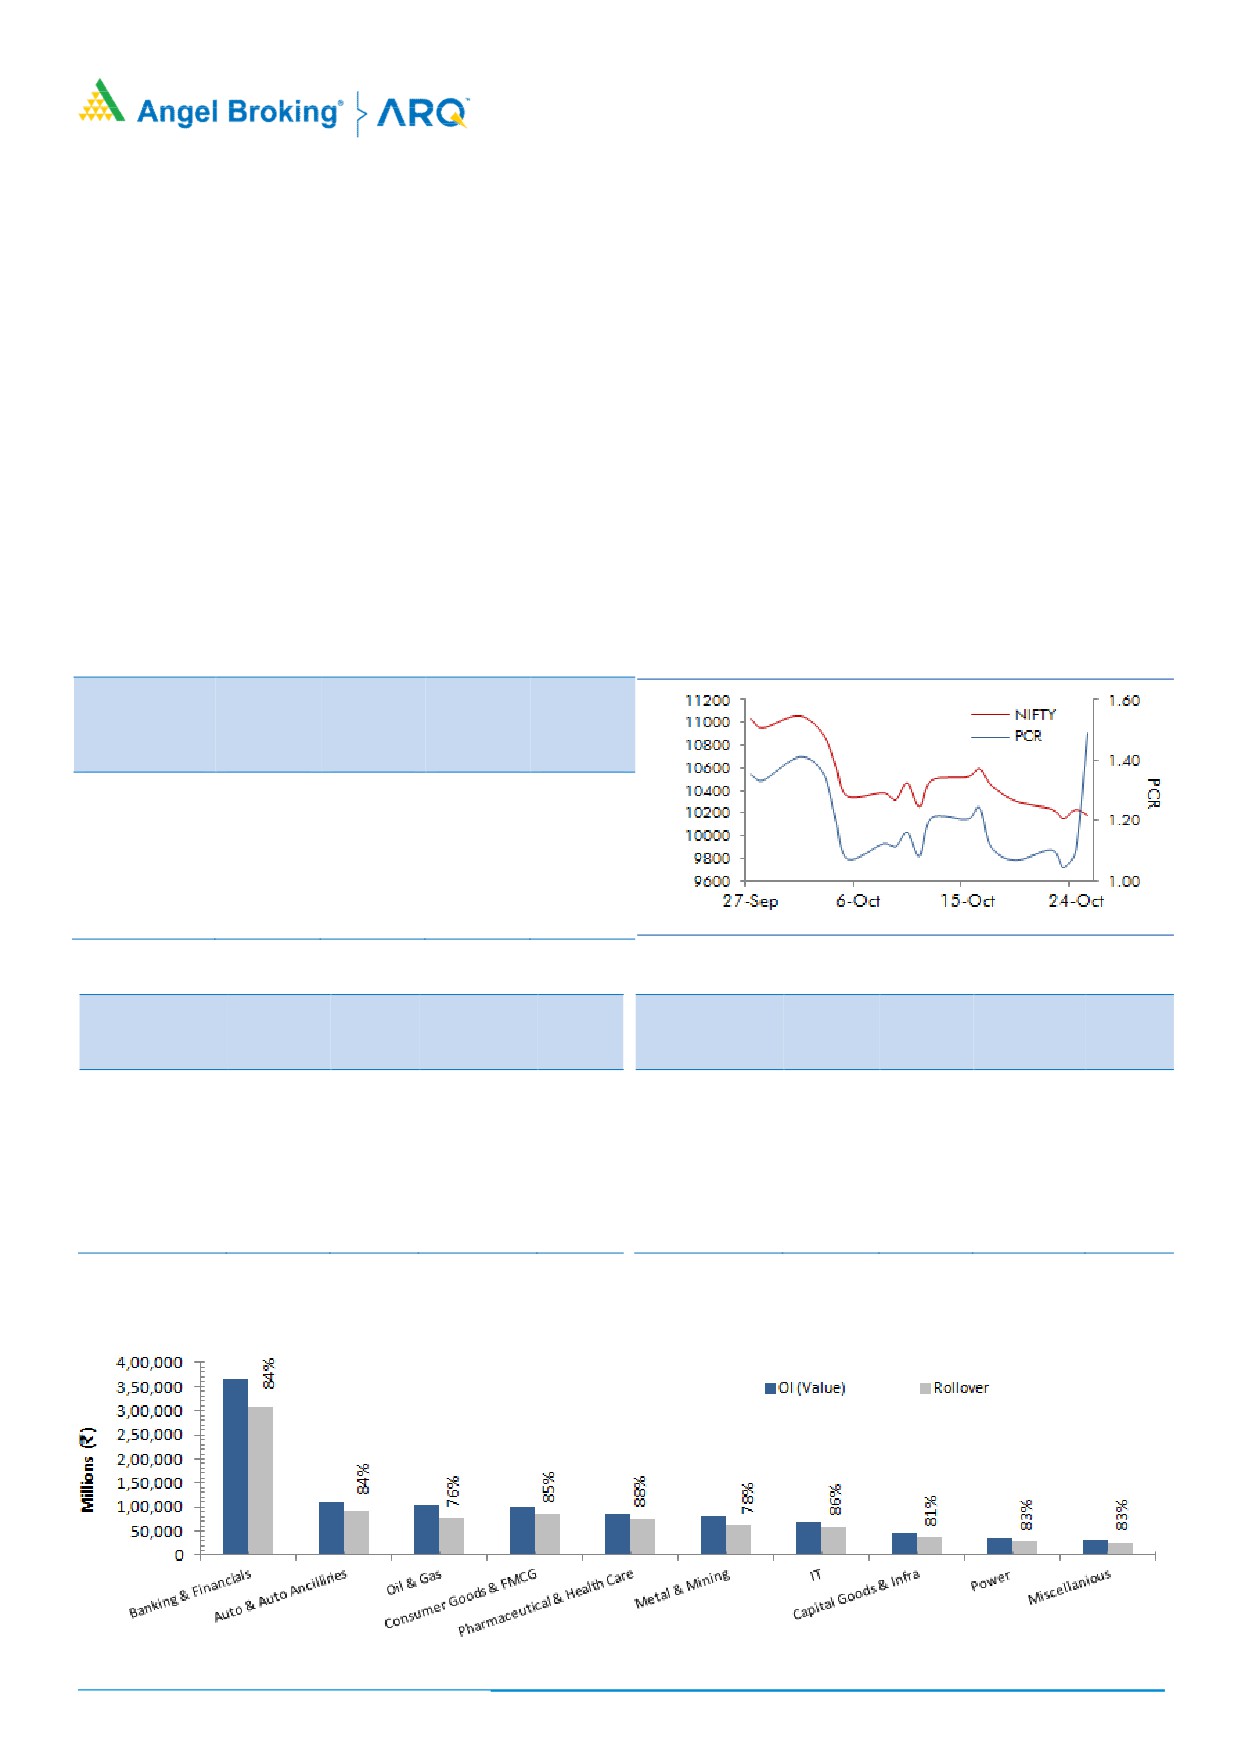
During the series, we saw good amount of short formation in Nifty futures and these positions have been rolled over too.
Rollovers for Nifty stood at 75.83%, higher than the 3-month average of 70.69%. Stronger hands (FIIs) continued adding
short positions in index futures throughout the October series and also preferred rolling it in the coming series. Their index
futures ‘Long Short Ratio’ has also plunged from 46% to 29%. However, FIIs were buyers in stock futures segment and these
positions are still intact. At present, 10000 is an important psychological support and till the time index sustains above these
levels traders should strictly avoid any bearish bets.
BankNifty rollovers were on the higher side in terms of percentage (78.68%) as well as OI. This sector really out-
performed the benchmark in last series. One of the important observation was, at every positive price action we saw
good amount of open interest additions; hence, we believe majority of the position rolled to November series are on
long side. Hence, we expect this entire banking pack to show strength going ahead.
I
ndices Change
NIFTY & PCR Graph
Price
Change
3 month
INDEX
Price
(%)
Rollover
avg.
NIFTY
10124.90
(7.76)
75.83
70.69
BANKNIFTY
24817.45
(0.98)
78.68
74.03
NIFTYIT
14070.80
(12.16)
78.69
74.50
NIFTYMID50
4462.35
(5.56)
99.98
99.97
NIFTYINFRA
-
-
-
-
Monthly Gainers
Monthly Losers
Price
Ol
Price
Ol
Change Open
Change
Change Open
Change
Scrip
Price
(%)
Interest
(%)
Scrip
Price
(%)
Interest
(%)
JETAIRWAYS
230.00
35.97
5428800
(16.91)
INFIBEAM
30.70
(84.82)
13200000
(67.25)
ADANIPOWER
33.40
29.71
160700000
9.54
DHFL
178.85
(38.72)
18123000
18.96
ADANIENT
173.50
21.29
33904000
(10.22)
DISHTV
36.50
(36.74)
43336000
17.79
IDBI
59.30
20.53
38110000
(28.53)
PCJEWELLER
48.00
(28.57)
9103500
8.61
FEDERALBNK
80.90
14.43
43538000
(9.86)
JINDALSTEL
163.30
(27.49)
24288750
(16.94)
Note: Stocks which have more than 1000 contract in Futures OI.
For Private Circulation Only
1
Derivatives Rollover Report
Average
Price
OI
Rollover
Change
Change
Rollover
(3month)
Scrip
Price
(%)
OI Futures
(%)
COC (%)
PCR-OI
(%)
(%)
AUTO & AUTO ANCILLARIES
AMARAJABAT
753.75
(0.93)
1159200
15.24
-25.79
1.02
80.35
75.66
APOLLOTYRE
207.25
(7.33)
7857000
(39.46)
1.04
1.68
79.46
84.54
ASHOKLEY
113.10
(6.64)
50752000
(15.16)
2.38
0.82
88.23
90.25
BAJAJ-AUTO
2487.60
(11.23)
2252000
(6.59)
4.35
1.53
71.01
81.53
BALKRISIND
1027.45
(2.30)
1528000
(19.00)
5.72
1.42
87.21
81.33
BHARATFORG
549.70
(10.94)
6622800
(17.59)
5.89
1.22
86.13
89.24
BOSCHLTD
19160.40
(3.89)
121440
3.79
7.25
2.00
94.49
89.44
CASTROLIND
146.50
0.48
7540400
(22.15)
-2.92
1.06
76.29
82.48
CEATLTD
1017.65
(13.88)
947100
(10.34)
1.74
1.16
85.26
82.94
EICHERMOT
22192.00
(11.46)
275450
13.83
4.85
1.26
79.66
82.06
ESCORTS
574.05
(11.73)
4065600
(30.51)
7.72
0.91
89.86
88.49
EXIDEIND
255.30
(4.86)
4896000
(1.92)
-0.84
1.00
82.93
78.61
HEROMOTOCO
2711.20
(12.79)
1377400
31.93
6.41
0.59
74.19
69.62
M&M
733.45
(16.80)
17107000
32.60
-0.44
0.94
84.44
84.36
MARUTI
6766.05
(11.07)
2846175
(5.43)
6.84
0.50
86.54
83.55
MOTHERSUMI
233.25
(10.48)
14550400
(4.46)
6.25
0.57
91.14
89.84
MRF
61741.40
(4.71)
21540
(24.58)
6.63
0.00
81.44
84.23
TATAMOTORS
166.50
(26.68)
63505500
(17.26)
7.47
0.48
88.08
88.50
TATAMTRDVR
91.85
(23.14)
26185600
(18.60)
6.47
1.79
87.31
91.73
TVSMOTOR
517.40
(9.74)
8719000
47.73
-3.62
0.41
81.88
76.66
BANKING & FINANCIALS
ALBK
37.15
3.77
13706000
(25.08)
0.00
1.14
96.96
96.58
AXISBANK
564.40
(6.52)
37396800
(0.58)
6.41
0.61
87.98
84.88
BAJAJFINSV
5395.90
(10.42)
729250
17.98
5.65
1.09
85.23
81.48
BAJFINANCE
2342.35
5.62
6683000
(6.61)
3.38
1.02
85.65
87.02
BANKBARODA
99.20
(5.57)
74924000
3.65
8.18
1.07
94.03
92.88
BANKINDIA
75.30
(6.86)
18948000
(7.06)
5.73
1.05
87.19
85.11
BHARATFIN
910.55
(13.31)
7623000
90.84
7.06
1.06
93.80
90.27
CANBK
213.05
(7.07)
8484000
(1.35)
7.10
0.74
89.44
89.39
CANFINHOME
258.85
13.21
4041250
4.76
7.94
0.30
71.49
88.83
CAPF
463.75
(7.31)
5960000
12.08
3.83
3.09
95.41
91.65
CHOLAFIN
1179.60
(0.57)
572500
(42.55)
-0.36
1.70
87.74
87.67
DCBBANK
157.30
9.50
4072500
(23.24)
-20.09
1.40
87.44
94.29
DHFL
178.85
(38.72)
18123000
18.96
-29.20
1.06
90.97
89.91
EQUITAS
128.80
1.30
9180000
(35.59)
4.60
1.15
90.50
90.55
FEDERALBNK
80.90
14.43
43538000
(9.86)
3.33
0.69
86.51
86.20
HDFC
1704.75
(2.09)
23973500
(2.54)
6.53
0.64
88.05
86.27
HDFCBANK
1982.05
(0.07)
12872000
1.78
7.22
0.68
75.99
71.36
For Private Circulation Only
2
Derivatives Rollover Report
Average
Price
OI
Rollover
Change
Change
Rollover
(3month)
Scrip
Price
(%)
OI Futures
(%)
COC (%)
PCR-OI
(%)
(%)
IBULHSGFIN
693.90
(26.49)
17389000
28.83
7.48
0.63
86.95
88.54
ICICIBANK
319.80
3.51
93005000
0.41
-0.50
0.86
83.48
80.37
ICICIPRULI
317.80
(6.30)
3996200
(8.81)
0.34
1.27
86.11
88.43
IDBI
59.30
20.53
38110000
(28.53)
7.29
1.06
89.59
91.48
IDFC
35.50
(12.24)
109388400
(8.63)
6.08
1.04
95.24
93.62
IDFCBANK
34.30
(7.05)
114939000
(2.34)
7.88
0.94
91.91
90.61
IFCI
12.80
3.64
51225000
(16.09)
4.21
0.98
92.26
94.19
INDIANB
219.65
(3.70)
4662000
(6.87)
6.39
0.46
95.30
88.34
INDUSINDBK
1499.85
(11.38)
6562200
25.48
6.30
0.61
74.07
73.03
KOTAKBANK
1191.10
3.44
10255200
(5.81)
4.80
1.15
69.73
70.38
KTKBANK
95.45
(5.07)
16623000
0.96
6.79
1.23
91.96
91.78
L&TFH
117.45
(6.82)
28552500
(29.32)
2.29
0.70
83.42
88.05
LICHSGFIN
411.80
(2.74)
9213600
(5.02)
5.77
1.35
86.80
85.92
M&MFIN
406.00
0.76
9892500
(2.01)
6.79
0.48
90.48
90.76
MANAPPURAM
72.90
(4.14)
14928000
(22.25)
2.95
0.67
71.87
83.28
MFSL
375.05
(11.17)
2104800
(5.80)
6.04
0.86
84.98
85.51
MUTHOOTFIN
389.00
(4.45)
1702500
(25.33)
0.14
0.52
74.43
82.80
ORIENTBANK
67.00
5.76
11340000
(14.98)
8.89
0.58
96.04
96.86
PFC
83.60
5.03
32556000
(58.96)
-7.02
0.74
40.41
74.67
PNB
66.10
4.92
102360500
(13.63)
7.36
0.76
89.98
89.93
RBLBANK
495.65
(5.96)
7172400
53.61
4.02
0.43
90.44
85.75
RECLTD
107.45
8.76
34218000
(17.62)
4.51
0.73
90.12
89.62
RELCAPITAL
235.00
(20.27)
10758000
7.95
7.59
0.87
82.43
81.72
REPCOHOME
343.55
(16.93)
583200
(2.56)
8.82
0.40
84.60
90.97
SBIN
251.35
(5.60)
91716000
17.85
7.74
0.85
82.22
81.61
SOUTHBANK
13.40
(2.19)
125206698
(4.55)
8.07
0.99
83.34
84.63
SREINFRA
29.80
(9.97)
11760000
(35.33)
7.25
3.41
94.06
94.34
SRTRANSFIN
1083.65
(6.63)
3778800
(19.10)
-0.99
0.84
88.12
89.35
SYNDIBANK
31.50
(1.56)
23562000
(8.94)
8.59
0.92
94.86
95.99
UJJIVAN
221.45
(15.93)
4484800
0.11
7.08
1.07
90.04
86.90
UNIONBANK
64.15
(5.73)
35634000
(3.90)
8.43
1.60
85.07
87.47
YESBANK
199.80
(2.44)
115339000
26.48
7.85
0.63
85.38
84.43
CAPITAL GOODS & INFRASTRUCTURE
ADANIPORTS
307.35
(8.68)
13442500
40.46
6.15
0.76
88.22
80.42
BEML
545.85
(13.35)
1539500
(16.51)
5.14
0.75
96.76
95.19
BHEL
70.30
(1.26)
42465000
17.88
0.76
0.56
75.61
81.95
CGPOWER
35.85
(22.90)
33660000
(4.17)
-4.47
0.61
97.57
96.33
ENGINERSIN
113.10
(7.82)
6461000
(38.05)
8.13
0.63
60.66
73.15
GMRINFRA
15.80
(6.23)
170280000
(14.56)
10.29
0.55
80.75
87.59
HAVELLS
603.25
(2.05)
4529000
13.23
7.08
0.79
91.09
86.84
HCC
12.00
3.45
28476000
(24.41)
13.59
0.51
85.28
92.06
IRB
121.25
(11.91)
12647500
(5.91)
7.58
0.38
87.15
88.08
For Private Circulation Only
3
Derivatives Rollover Report
Average
Price
OI
Rollover
Change
Change
Rollover
(3month)
Scrip
Price
(%)
OI Futures
(%)
COC (%)
PCR-OI
(%)
(%)
JPASSOCIAT
6.20
(17.33)
105332000
(1.71)
17.60
0.46
84.46
87.43
LT
1210.20
(7.80)
10524750
(1.40)
7.73
0.73
74.95
74.15
NBCC
54.50
(12.24)
22578000
1.95
-6.85
0.84
78.53
86.82
RELINFRA
342.70
12.14
6266000
(24.09)
2.35
1.11
87.11
84.85
SIEMENS
881.00
(7.15)
1121000
(24.46)
2.69
0.80
96.35
98.42
VOLTAS
511.70
(3.76)
3326000
5.72
-30.57
0.46
77.55
78.86
CEMENT
ACC
1362.35
(13.21)
888800
(37.86)
-4.12
1.76
69.81
79.26
AMBUJACEM
194.10
(14.59)
10522500
(19.68)
8.64
0.99
82.43
81.67
DALMIABHA
2060.60
(12.82)
370500
(2.37)
-27.32
1.31
64.59
82.11
GRASIM
790.10
(23.43)
5706000
60.44
7.39
1.22
87.44
82.22
INDIACEM
82.10
(21.81)
18305000
6.54
5.92
0.58
81.94
86.50
RAMCOCEM
567.60
(12.68)
704000
2.21
-6.58
0.50
73.39
82.01
SHREECEM
13623.85
(22.26)
107100
7.31
7.43
0.00
87.75
91.31
ULTRACEMCO
3365.25
(18.44)
1915200
(7.82)
5.69
0.78
85.25
86.27
CHEMICALS & FERTILIZERS
GSFC
93.95
(0.21)
13018500
(3.21)
6.32
1.45
93.11
94.67
PIDILITIND
939.70
(11.50)
2935000
(5.38)
7.01
1.34
94.74
93.10
TATACHEM
670.20
(2.49)
2328000
(19.19)
5.96
0.49
87.76
90.16
UPL
602.70
(12.33)
15930000
8.21
5.82
0.96
85.51
88.91
CONSUMER GOODS & FMCG
ASIANPAINT
1199.60
(7.13)
5015400
(0.52)
-0.40
0.87
81.94
77.55
BERGEPAINT
282.25
(2.86)
2316600
24.47
-32.10
0.75
94.35
95.54
BRITANNIA
5345.10
(6.62)
1338800
0.50
7.24
2.35
93.48
93.06
COLPAL
1106.65
0.54
1446200
2.63
-5.36
0.24
86.48
87.36
DABUR
400.00
(9.07)
15740000
10.15
3.91
0.77
92.94
91.69
GODFRYPHLP
721.40
(3.66)
472500
(20.31)
3.88
0.71
96.84
94.80
GODREJCP
705.35
(10.84)
4312800
7.38
5.51
3.50
82.85
85.27
HINDUNILVR
1582.60
(2.95)
7852200
(8.62)
7.55
0.64
73.30
79.28
ITC
289.00
(2.03)
62858400
0.15
5.41
1.22
83.66
80.95
JUBLFOOD
1081.10
(13.37)
3067500
(5.21)
7.00
0.38
77.98
80.54
MARICO
297.65
(11.91)
5597800
(32.47)
0.36
0.81
61.46
82.03
MCDOWELL-N
537.05
3.54
11326250
4.64
3.11
0.46
93.85
94.09
NESTLEIND
9591.80
(0.40)
445000
33.59
6.03
0.94
95.13
90.81
TATAGLOBAL
223.70
(4.40)
8901000
(18.30)
7.73
1.18
85.91
87.48
TITAN
796.05
(3.44)
14167500
5.08
6.51
0.77
88.73
89.53
UBL
1171.40
(17.58)
1600200
1.33
7.06
0.82
98.58
97.27
For Private Circulation Only
4
Derivatives Rollover Report
Average
Price
OI
Rollover
Change
Change
Rollover
(3month)
Scrip
Price
(%)
OI Futures
(%)
COC (%)
PCR-OI
(%)
(%)
METALS & MINING
COALINDIA
283.55
2.12
14484800
(17.39)
5.14
0.65
75.91
78.99
HINDALCO
223.90
(8.78)
31318000
(12.45)
7.48
0.46
88.95
86.65
HINDZINC
272.25
(7.22)
6860800
(6.86)
-24.28
0.45
69.48
77.45
JINDALSTEL
163.30
(27.49)
24288750
(16.94)
6.95
1.04
85.46
89.97
JSWSTEEL
355.70
(11.52)
47904000
(6.03)
6.99
0.71
76.33
83.47
NATIONALUM
66.65
2.30
30736000
(37.61)
5.67
0.34
81.90
84.67
NMDC
106.30
(10.33)
18996000
(10.13)
6.09
1.12
68.84
79.27
SAIL
63.30
(15.20)
67956000
(2.58)
6.83
1.26
85.15
87.84
TATASTEEL
549.10
(10.40)
28804028
(19.55)
6.59
0.80
89.12
91.69
VEDL
204.55
(15.32)
32324250
(33.83)
-0.26
0.93
71.94
80.01
INFORMATION TECHNOLOGY
HCLTECH
1007.85
(8.34)
7404600
0.19
3.21
0.61
86.53
81.72
HEXAWARE
331.85
(24.34)
5370000
30.80
0.81
0.35
89.08
82.08
INFY
652.20
(9.81)
32164800
25.26
5.71
2.21
81.76
74.66
KPIT
210.60
(13.40)
8595000
(8.57)
0.25
1.25
96.12
95.74
MINDTREE
785.10
(25.95)
4452000
22.64
7.43
0.74
88.86
87.64
NIITTECH
1189.85
5.47
1348500
(23.81)
7.68
0.85
95.59
95.29
OFSS
3610.40
(8.96)
226350
(33.47)
-0.74
0.00
79.01
74.93
TATAELXSI
961.55
(18.88)
1536000
(14.13)
6.97
0.97
84.21
85.76
TCS
1862.90
(15.38)
8900000
33.05
5.74
1.73
80.48
72.07
TECHM
655.95
(12.59)
14068800
(2.58)
7.50
1.49
88.16
87.27
WIPRO
320.40
(0.25)
29925600
10.37
6.23
1.11
89.36
83.99
MISCELLANIOUS
ADANIENT
173.50
21.29
33904000
(10.22)
8.73
0.17
90.09
87.04
APOLLOHOSP
1115.30
3.72
814500
(33.94)
5.51
0.42
72.21
80.97
BATAINDIA
923.60
(6.63)
1758900
7.32
0.52
0.39
82.34
78.24
BEL
83.80
1.33
24284700
(36.59)
5.80
0.86
85.96
85.79
CONCOR
554.20
(11.20)
2237500
3.05
7.90
0.45
46.82
76.55
CUMMINSIND
677.00
(0.29)
746200
(36.81)
3.82
0.82
81.75
77.85
GODREJIND
450.90
(14.02)
2271000
20.54
4.54
2.15
96.74
98.00
INDIGO
873.80
3.61
4203600
35.64
-5.07
0.93
84.97
85.56
INFIBEAM
30.70
(84.82)
13200000
(67.25)
-3.49
0.75
67.05
71.94
JETAIRWAYS
230.00
35.97
5428800
(16.91)
3.98
0.91
88.57
89.52
JISLJALEQS
65.40
(9.61)
33777000
(5.85)
6.61
1.36
87.95
90.23
JUSTDIAL
448.80
(11.46)
2017400
(8.91)
2.52
0.73
96.00
97.06
KAJARIACER
364.80
(4.66)
2143000
(14.31)
10.25
0.81
75.64
83.15
KSCL
474.20
(22.79)
793500
8.18
-3.72
0.61
92.81
90.14
For Private Circulation Only
5
Derivatives Rollover Report
Average
Price
OI
Rollover
Change
Change
Rollover
(3month)
Scrip
Price
(%)
OI Futures
(%)
COC (%)
PCR-OI
(%)
(%)
MCX
705.10
(1.54)
4069100
(7.52)
5.74
0.57
90.83
92.92
PCJEWELLER
48.00
(28.57)
9103500
8.61
-8.87
0.56
82.77
80.76
VGUARD
167.05
(7.19)
2769000
10.80
-33.92
0.71
96.35
96.87
OIL & GAS
BPCL
278.60
(25.62)
14540400
81.37
6.20
0.47
78.37
77.30
CHENNPETRO
258.90
(8.65)
1086000
(2.03)
3.74
0.17
94.39
87.93
GAIL
342.50
(9.87)
20149185
30.96
8.69
0.58
65.62
73.22
HINDPETRO
227.50
(9.29)
21125475
(11.08)
5.22
0.93
85.18
86.01
IGL
255.20
(1.05)
2125750
(36.95)
4.65
1.24
63.36
74.08
IOC
139.50
(9.33)
29283000
17.49
-4.60
0.85
83.69
80.99
MGL
825.10
(0.40)
1633800
(33.11)
2.41
0.73
98.62
96.33
MRPL
83.75
11.89
4468500
(11.42)
6.45
0.43
88.66
93.39
OIL
197.85
(8.66)
2352108
(23.79)
-18.40
1.00
81.22
90.26
ONGC
155.65
(12.09)
33581250
(22.70)
2.07
1.09
60.74
76.05
PETRONET
213.25
(6.65)
10341000
(17.14)
5.06
1.07
63.31
81.68
RELIANCE
1037.00
(17.82)
46180000
13.50
6.46
0.45
78.69
80.42
PHARMACEUTICAL
AJANTPHARM
993.50
(10.17)
474000
(26.63)
-2.10
2.80
96.64
96.81
AUROPHARMA
723.90
(2.95)
18210000
(18.04)
4.39
0.79
90.82
93.20
BIOCON
621.90
(12.43)
6000300
(14.13)
6.25
0.46
85.86
88.20
CADILAHC
342.65
(12.24)
8585600
(23.13)
6.14
0.52
86.41
85.89
CIPLA
613.35
(7.00)
8544000
(18.26)
7.67
0.90
71.38
78.32
DIVISLAB
1257.75
(8.63)
2387200
2.54
4.07
0.55
89.50
88.57
DRREDDY
2407.10
(5.98)
3970750
(0.97)
7.45
2.13
85.69
87.40
GLENMARK
615.15
(5.05)
3711000
9.18
4.47
0.45
92.11
88.41
GRANULES
92.30
(6.86)
12930000
(8.88)
5.26
1.77
94.55
93.52
LUPIN
855.45
(5.33)
8026900
(14.52)
5.23
0.77
86.26
84.33
PEL
1875.55
(21.30)
3639402
9.40
5.90
0.55
93.14
93.53
STAR
396.05
(14.63)
3838400
(18.19)
4.35
1.73
89.41
91.66
SUNPHARMA
560.30
(11.50)
29883700
(4.39)
2.98
0.77
88.94
89.06
TORNTPHARM
1586.15
(6.26)
451500
(21.75)
4.86
0.21
88.01
87.01
WOCKPHARMA
465.10
(17.78)
3326400
(1.23)
6.50
1.38
98.48
97.87
REAL ESTATE
DLF
155.40
(10.30)
25752500
(1.57)
3.12
1.43
90.06
89.31
NCC
66.25
(16.14)
44864000
(2.94)
8.99
0.65
82.47
85.62
For Private Circulation Only
6
Derivatives Rollover Report
POWER
ADANIPOWER
33.40
29.71
160700000
9.54
13.01
1.87
97.13
97.72
CESC
841.00
(4.09)
3172400
(46.17)
8.62
0.59
67.35
85.54
NHPC
24.30
5.42
18576000
(18.87)
0.00
0.38
95.56
90.64
NTPC
162.75
(3.67)
35164000
4.57
2.98
0.58
66.79
73.74
POWERGRID
192.30
(1.61)
36264000
(10.17)
5.61
1.48
90.59
86.21
PTC
76.25
11.31
9472000
(16.50)
0.70
0.79
97.13
83.22
RPOWER
27.95
7.71
43004000
(13.70)
9.69
2.12
95.03
95.47
SUZLON
6.10
0.83
277155000
(11.62)
8.87
0.89
88.90
89.33
TATAPOWER
69.55
0.65
39708000
(10.89)
8.56
0.54
88.72
90.46
TORNTPOWER
225.70
0.56
1920000
(3.90)
5.26
1.31
89.26
88.74
TELECOM
BHARTIARTL
295.90
(17.59)
45039800
(6.30)
1.27
0.73
73.69
84.52
IDEA
37.50
(3.35)
134064000
(13.43)
7.20
1.01
92.28
91.59
INFRATEL
259.40
(4.05)
5273400
27.76
-22.69
1.03
56.68
60.16
RCOM
10.40
(15.45)
83720000
(12.32)
5.19
0.70
82.53
91.29
TATACOMM
449.90
(11.45)
2835200
(6.71)
0.12
0.19
93.78
92.45
TEXTILES
ARVIND
321.20
(5.22)
5002000
(38.69)
6.56
1.59
78.52
81.69
CENTURYTEX
780.60
(8.83)
5867400
(11.12)
5.25
1.07
90.51
91.91
PAGEIND
28678.75
(13.11)
107750
(10.53)
4.60
0.00
88.23
83.53
RAYMOND
622.20
(11.81)
4344000
(13.20)
6.77
3.00
93.40
92.71
SRF
1748.65
(3.66)
633500
(15.02)
4.96
2.98
97.91
96.12
MEDIA
DISHTV
36.50
(36.74)
43336000
17.79
-13.07
1.04
78.04
85.88
PVR
1288.65
2.36
1196000
21.10
3.85
0.89
98.91
97.22
SUNTV
618.05
(0.96)
6397000
(7.18)
4.62
0.80
86.57
86.89
TV18BRDCST
36.85
0.68
47149500
(9.79)
5.86
1.01
99.20
97.42
ZEEL
435.25
(3.00)
9981400
(2.51)
6.95
1.16
89.78
85.53
For Private Circulation Only
7
Derivatives Rollover Report
Research Team Tel: 022 - 39357800 Extn-6824
Website: www.angelbroking.com
DISCLAIMER
Angel Broking Limited (hereinafter referred to as “Angel”) is a registered Member of National Stock Exchange of India Limited,
Bombay Stock Exchange Limited and Metropolitan Stock Exchange Limited. It is also registered as a Depository Participant with CDSL
and Portfolio Manager and Investment Adviser with SEBI. It also has registration with AMFI as a Mutual Fund Distributor. Angel
Broking Limited is a registered entity with SEBI for Research Analyst in terms of SEBI (Research Analyst) Regulations, 2014 vide
registration number INH000000164. Angel or its associates has not been debarred/ suspended by SEBI or any other regulatory
authority for accessing /dealing in securities Market. Angel or its associates/analyst has not received any compensation / managed
or co-managed public offering of securities of the company covered by Analyst during the past twelve months.
This document is solely for the personal information of the recipient, and must not be singularly used as the basis of any investment
decision. Nothing in this document should be construed as investment or financial advice. Each recipient of this document should
make such investigations as they deem necessary to arrive at an independent evaluation of an investment in the securities of the
companies referred to in this document (including the merits and risks involved), and should consult their own advisors to determine
the merits and risks of such an investment.
Reports based on technical and derivative analysis center on studying charts of a stock's price movement, outstanding positions and
trading volume, as opposed to focusing on a company's fundamentals and, as such, may not match with a report on a company's
fundamentals. Investors are advised to refer the Fundamental and Technical Research Reports available on our website to evaluate
the contrary view, if any.
The information in this document has been printed on the basis of publicly available information, internal data and other reliable
sources believed to be true, but we do not represent that it is accurate or complete and it should not be relied on as such, as this
document is for general guidance only. Angel Broking Limited or any of its affiliates/ group companies shall not be in any way
responsible for any loss or damage that may arise to any person from any inadvertent error in the information contained in this
report. Angel Broking Limited has not independently verified all the information contained within this document. Accordingly, we
cannot testify, nor make any representation or warranty, express or implied, to the accuracy, contents or data contained within this
document. While Angel Broking Limited endeavors to update on a reasonable basis the information discussed in this material, there
may be regulatory, compliance, or other reasons that prevent us from doing so.
This document is being supplied to you solely for your information, and its contents, information or data may not be reproduced,
redistributed or passed on, directly or indirectly.
Neither Angel Broking Limited, nor its directors, employees or affiliates shall be liable for any loss or damage that may arise from or
in connection with the use of this information.
Derivative Research Team
[email protected]
For Private Circulation Only
8